Measure User Engagement
Enhance Learning Experiences with Deep Insights
We all need our online experiences to be memorable.
Analytics can help with planning your next event. With knowledge of what worked and what didn’t in your event, you will be able to continuously improve your experience.
Harnessing analytics is a must for event administrators and managers who want to successfully execute learning programs and workshops.
Greater Insights Lead to Better Experiences
Watch and Learn does not only provide data on the digital footfall of your event; we also help you track other key metrics to constantly improve your learning experience.
Here are some of the ways Watch and Learn allows you to reap benefits from the data.
Track Engagement Levels on Live Stage

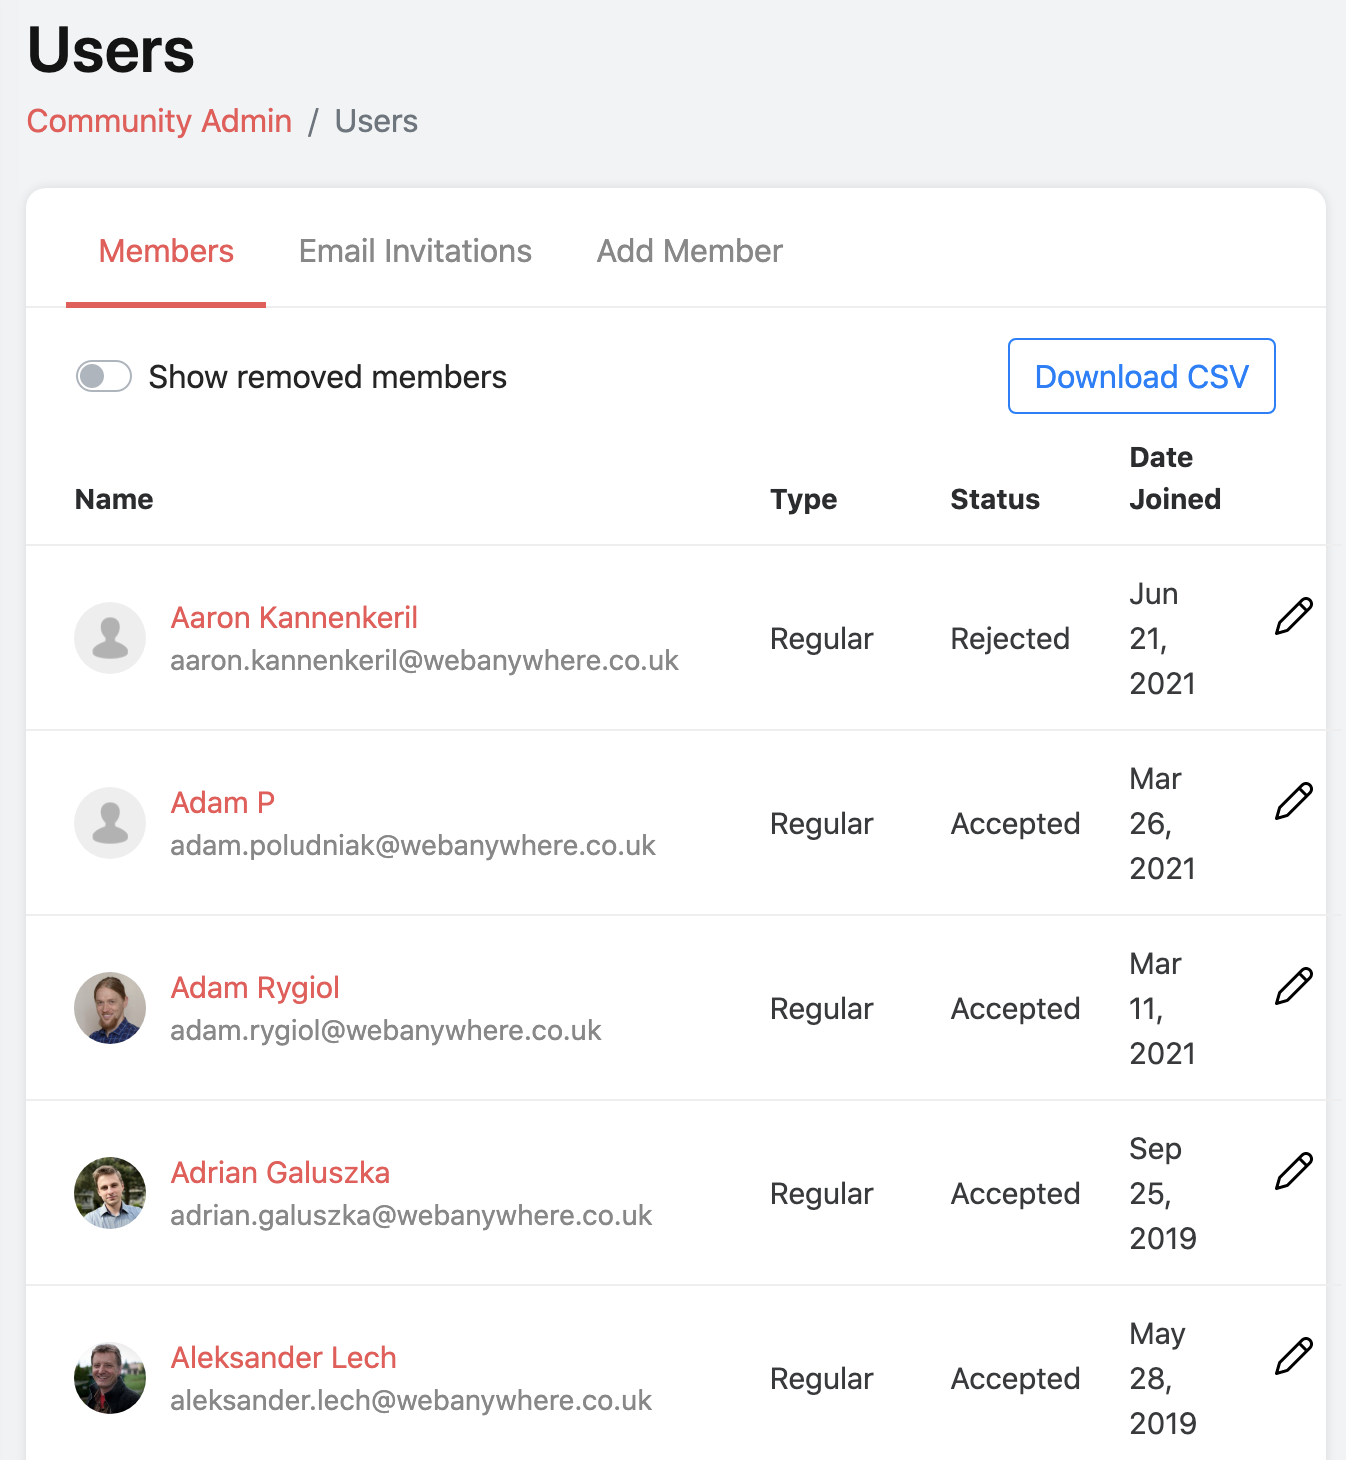
Downloadable CSV files show you who registered to learn, who attended and for how long. You get to see when someone joined a session and when they left giving you a paper trial.
Track Engagement For The Expo Hall and Meetings
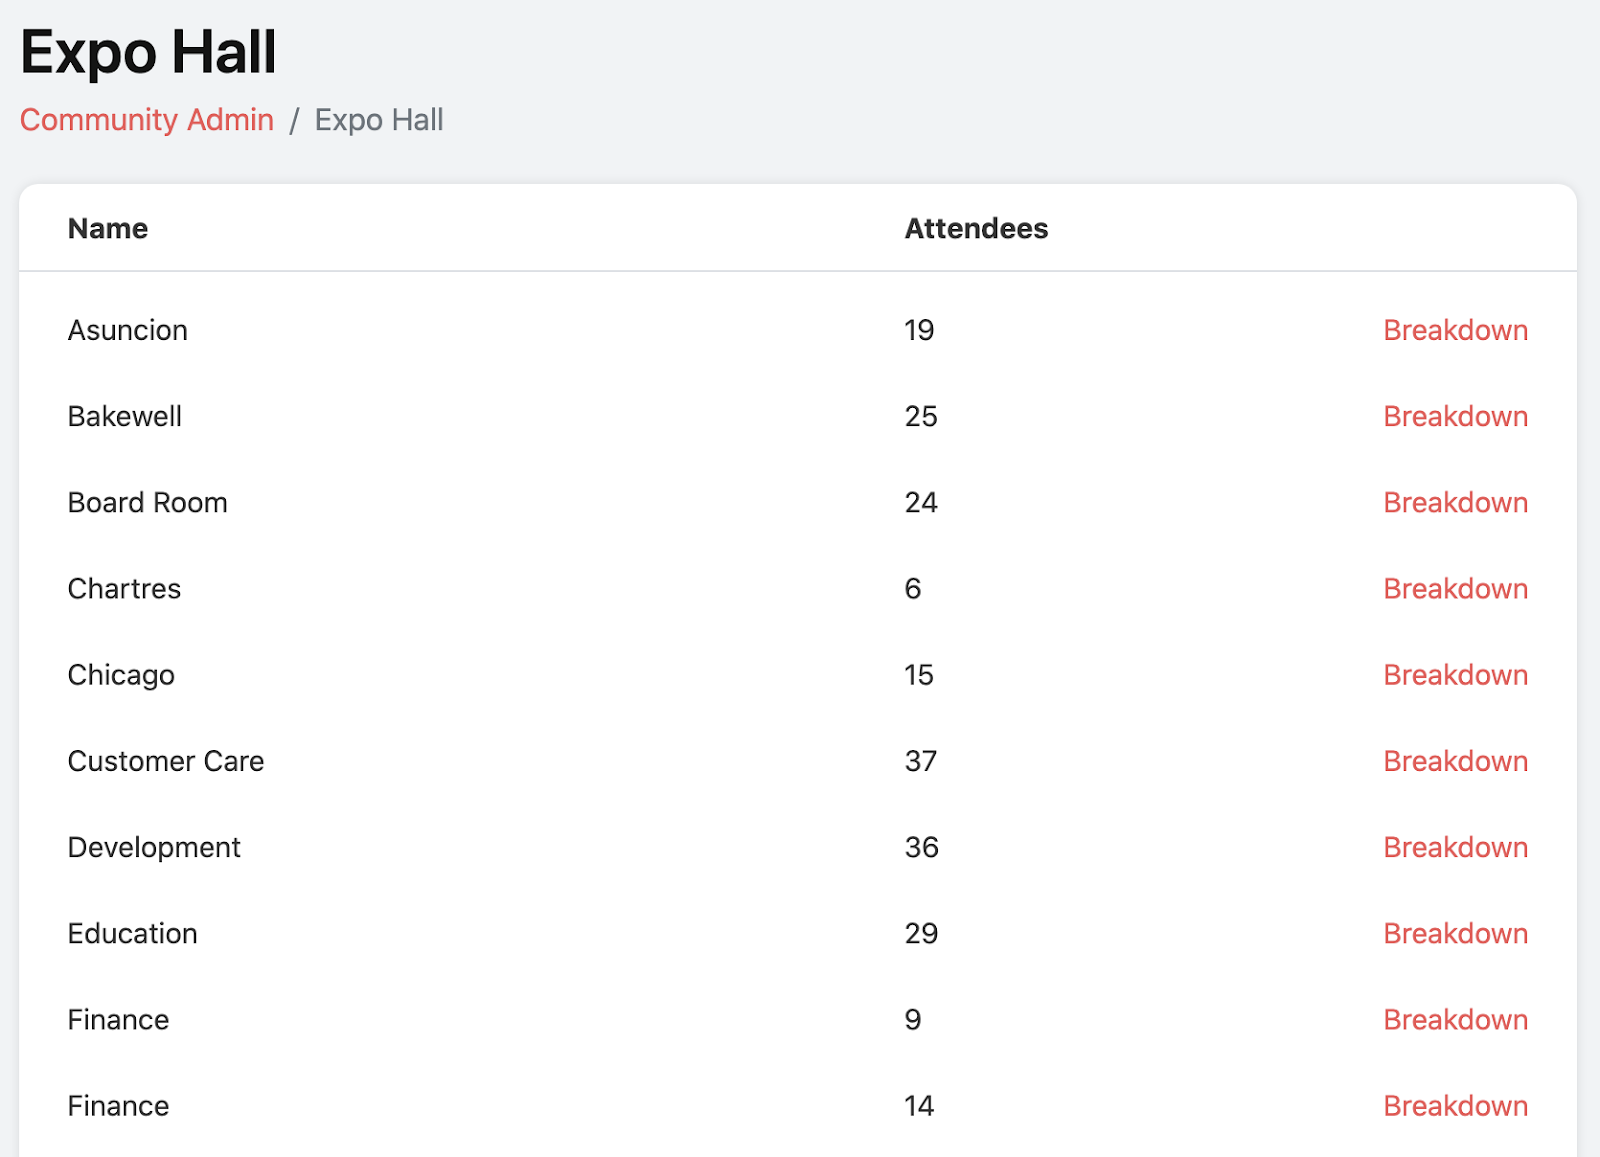
Observe, track and analyze who attended each video room and virtual booth. See how long people stayed alongside their names and roles.

Measure and Evaluate Video Analytics

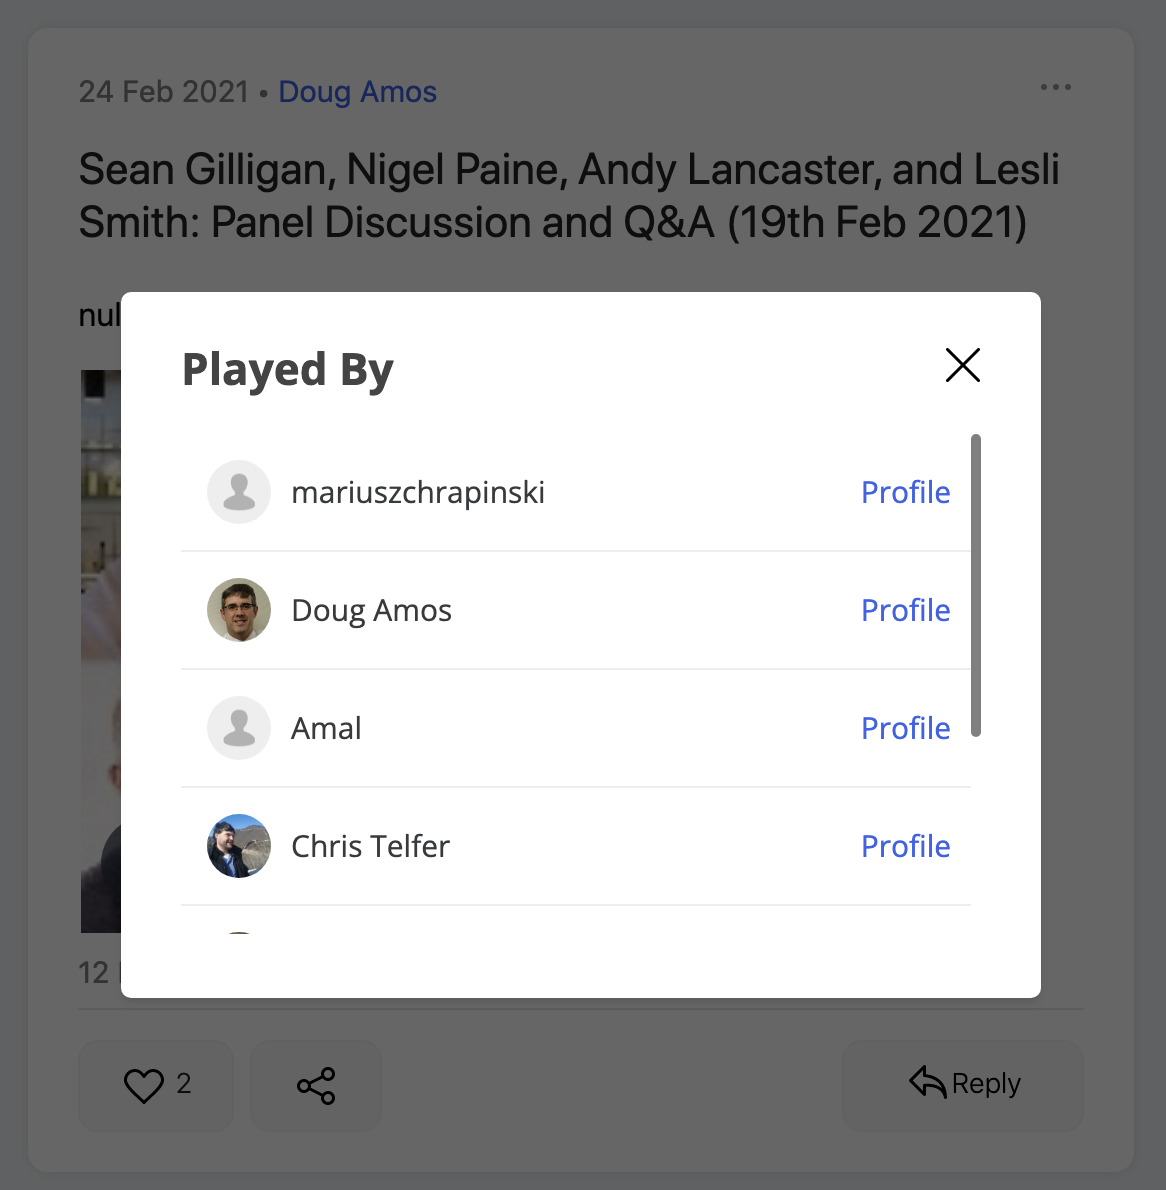
Stay abreast of video analytics including the number of plays per video and who played each video to see which content is engaging.
Trace Conversational Analytics
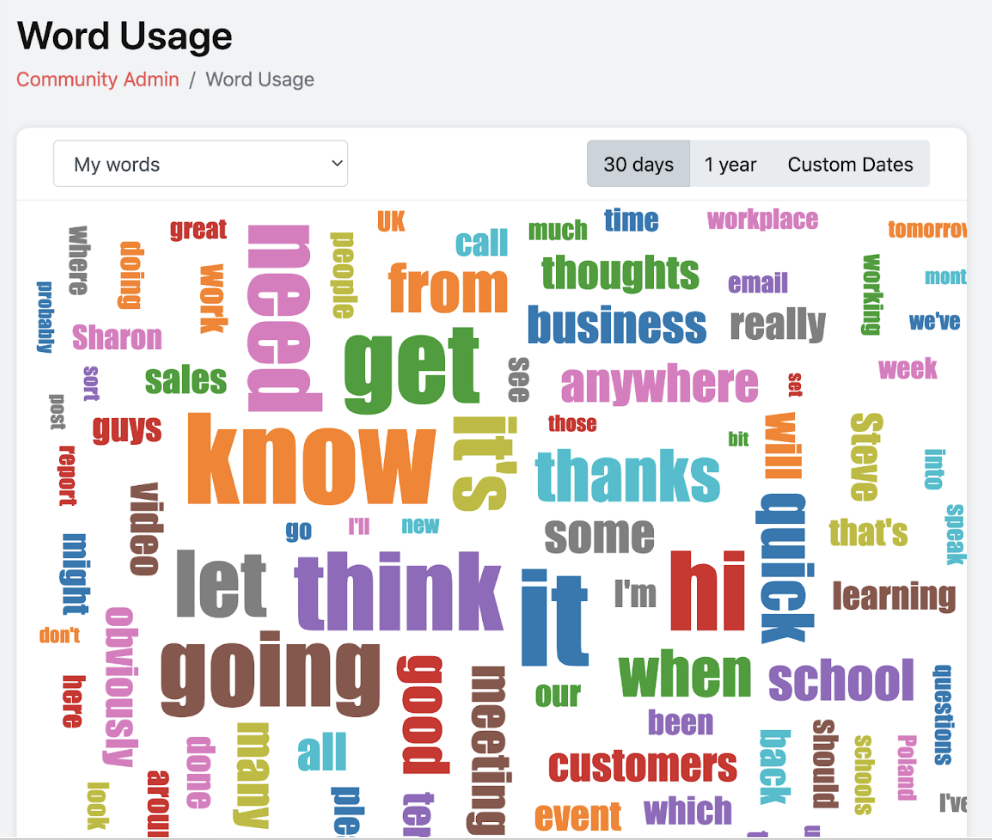
See conversational analytics including the words which have been most frequently used with Wordle Graphs

Putting Event Insights and Analytics into Action
Our data analytics will help you churn out meaningful information, allowing you to better understand your participants, and enabling your events to become more impactful.
Here are five ways you can put event data and insights into real action for your programs:
- Improvement in engagement based on analytics
- Personalization of content
- Uncovering trends and patterns
- Understanding your users’ behaviour and engagement levels with respect to content type
- Measurement of Return On Investment (ROI)